Using State Machines In .NET - Part 10 - Generating State Diagrams
[C#, .NET, Stateless, StarLibrary]
This is Part 10 of a series on using State Machines to express complex logic.
- Using State Machines In .NET - Part 1 - Introduction
- Using State Machines In .NET - Part 2 - Basic Usage
- Using State Machines In .NET - Part 3 - Setting Initial State
- Using State Machines In .NET - Part 4 - Using Multiple Triggers
- Using State Machines In .NET - Part 5 - Using Complex & Nested States
- Using State Machines In .NET - Part 6 - Firing Events On State Change
- Using State Machines In .NET - Part 7 - Conditional State Transitions
- Using State Machines In .NET - Part 8 - Firing Events Before State Change
- Using State Machines In .NET - Part 9 - Calling Asynchronous Methods
- Using State Machines In .NET - Part 10 - Generating State Diagrams (This Post)
- Using State Machines In .NET - Part 11 - Logic Based On How A State Was Transitioned
- Using State Machines In .NET - Part 12 - State Activation & Entry
In our last post in the series, we looked at how to call asynchronous methods when transitioning between states.
This post will look at how to visualize state machines using state diagrams.
The type we will use is our Jukebox.
public sealed class Jukebox
{
    public Status CurrentStatus => _stateMachine.State;

    // State machine
    private readonly StateMachine<Status, Trigger> _stateMachine;

    public Jukebox(IMediaService service)
    {
        _stateMachine = new StateMachine<Status, Trigger>(Status.Ready);
        var mediaPlayer = new MediaPlayer();

        //
        // Configure state machine
        //
        _stateMachine.Configure(Status.Ready)
            .Permit(Trigger.Play, Status.Playing);

        _stateMachine.Configure(Status.Playing)
            .Permit(Trigger.Stop, Status.Ready)
            .Permit(Trigger.Pause, Status.Paused)
            .OnEntryAsync(async () =>
            {
                // Get a random song between 0 and 1000
                var musicStream = await service.GetSong(Random.Shared.Next(1000));
                // Play the music
                mediaPlayer.Play(musicStream);
            });

        _stateMachine.Configure(Status.Paused)
            .Permit(Trigger.Play, Status.Playing)
            .Permit(Trigger.Stop, Status.Ready)
            .OnEntry(() =>
            {
                // Pause the music
                mediaPlayer.Pause();
            });
    }

    public async Task Play()
    {
        await _stateMachine.FireAsync(Trigger.Play);
    }

    public void Pause()
    {
        _stateMachine.Fire(Trigger.Pause);
    }

    public void Stop()
    {
        _stateMachine.Fire(Trigger.Stop);
    }
}
The state machine can output its representation in various formats:
To get the DOTGraph implementation, we add a property to the Jukebox as follows:
public string ToDotGraph => UmlDotGraph.Format(_stateMachine.GetInfo());
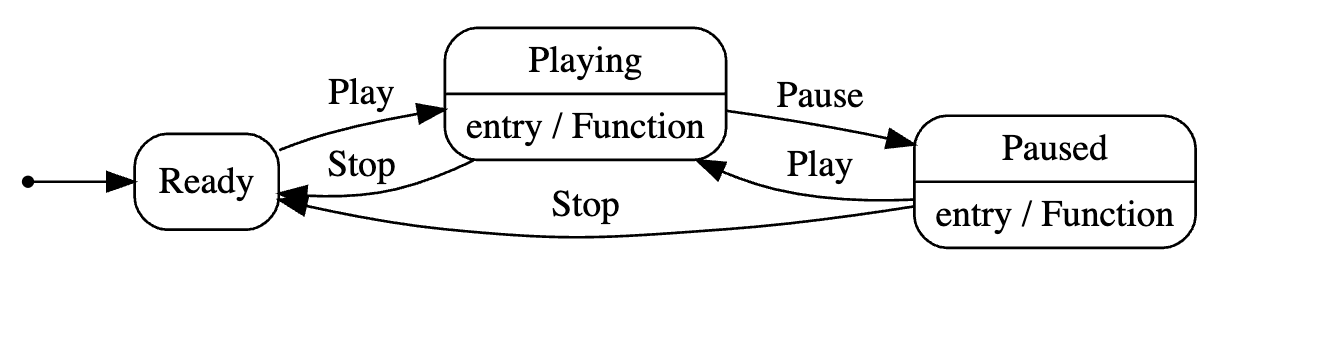
If we get the value of this property, we get the following output:
digraph {
compound=true;
node [shape=Mrecord]
rankdir="LR"
"Ready" [label="Ready"];
"Playing" [label="Playing|entry / Function"];
"Paused" [label="Paused|entry / Function"];

"Ready" -> "Playing" [style="solid", label="Play"];
"Ready" -> "Paused" [style="solid", label="Pause"];
"Playing" -> "Ready" [style="solid", label="Stop"];
"Playing" -> "Paused" [style="solid", label="Pause"];
"Paused" -> "Playing" [style="solid", label="Play"];
"Paused" -> "Ready" [style="solid", label="Stop"];
 init [label="", shape=point];
 init -> "Ready"[style = "solid"]
}
This can be visualized using a tool like WebGraphviz
To get the Mermaid implementation, we add the following property to the Jukebox:
public string ToMermaid => MermaidGraph.Format(_stateMachine.GetInfo());
If we get the value of this property, we get the following output:
stateDiagram-v2
	Ready --> Playing : Play
	Ready --> Paused : Pause
	Playing --> Ready : Stop
	Playing --> Paused : Pause
	Paused --> Playing : Play
	Paused --> Ready : Stop
[*] --> Ready
This can be visualized using a tool like Mermaid Live
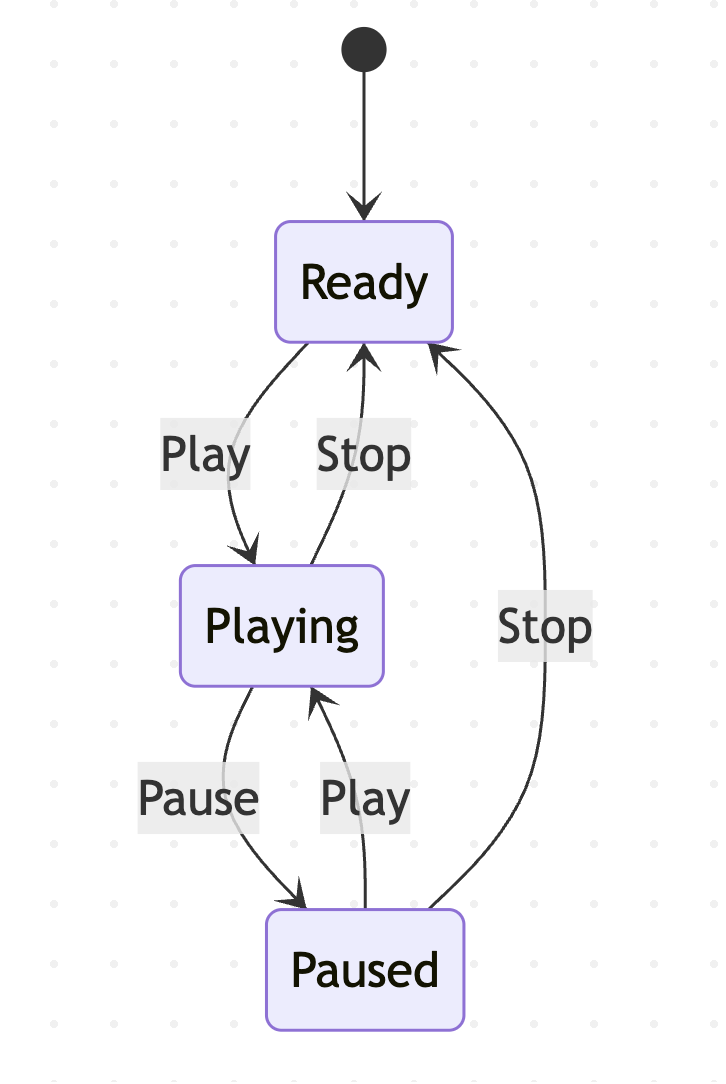
Mermaid is also natively supported by tools like GitHub.
Thus, we can always get a visual representation of our state machine to ensure that it is configured correctly.
TLDR
The Stateless library can output the state transition diagrams in Mermaid or DOTGraph format.
The code is in my GitHub.
Happy hacking!